
How To Properly Use Technical Analysis in Crypto Trading
Technical analysis is a popular method traders use to evaluate and predict the price movements of cryptocurrencies by analyzing statistical trends gathered from trading activity. Unlike fundamental analysis, which assesses the intrinsic value of an asset, technical analysis focuses on patterns and indicators to make trading decisions. This article will explore tools and techniques for applying technical analysis to cryptocurrency investments.
Definition
Technical analysis uses historical price data, volume, and other market statistics to predict future price movements. Traders use various tools and indicators to identify patterns and trends that indicate potential buying or selling opportunities.
Key Tools for Technical Analysis
1. Price charts
Price charts are the foundation of technical analysis. They provide a visual representation of an asset’s price movement over time. The most common types of charts used in crypto trading are:
- Line Charts: Simple charts plotting closing prices over a specified period.
- Bar Charts: Charts that show the opening, closing, high, and low prices for each period.
- Candlestick Charts: Similar to bar charts but with more visual information, including the direction of price movement.
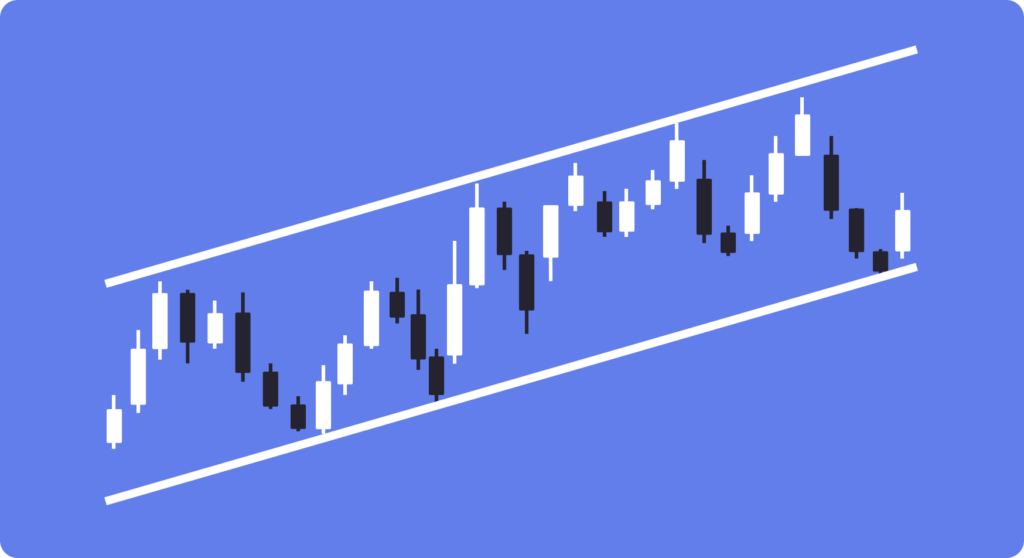
2. Trend lines
Trend lines are straight lines drawn on a price chart to connect two or more price points. They help identify the direction of the market trend:
- Uptrend Line: Drawn by connecting the lows in an upward trend, indicating support levels.
- Downtrend Line: Drawn by connecting the highs in a downward trend, indicating resistance levels.
3. Moving Averages
Moving averages smooth out price data to identify trends by filtering out short-term fluctuations:
- Simple Moving Average (SMA): The average price over a specific number of periods.
- Exponential Moving Average (EMA): Similar to SMA but gives more weight to recent prices, making it more responsive to new information.
4. Volume Indicators
Volume indicators measure the amount of trading activity and can confirm the strength of a trend. Common volume indicators include:
- Volume: The total number of units traded in a specified period.
- On-Balance Volume (OBV): Combines price and volume to show buying and selling pressure.
5. Momentum Indicators
Momentum indicators measure the speed and magnitude of price changes, helping identify overbought or oversold conditions:
- Relative Strength Index (RSI): Measures the speed and change of price movements on a scale of 0 to 100. Values above 70 indicate overbought conditions, while values below 30 indicate oversold conditions.
- Moving Average Convergence Divergence (MACD): Shows the relationship between two moving averages (usually the 26-day EMA and the 12-day EMA) and a signal line (9-day EMA). It helps identify bullish and bearish momentum.
6. Bollinger Bands
Bollinger Bands consist of a middle band (SMA) and two outer bands that are standard deviations away from the middle band. They help identify volatility and potential price reversals.
7. Fibonacci Retracement Levels
Fibonacci retracement levels are horizontal lines that indicate potential support and resistance levels based on Fibonacci numbers. They are used to predict the extent of price corrections during a trend.
Techniques for Applying Technical Analysis
- Identifying Trends
Determining the direction of the market trend is crucial for making informed trading decisions. Use trend lines and moving averages to identify whether the market is in an uptrend, downtrend, or sideways trend.
2. Using Support and Resistance Levels
Support levels are price points where an asset tends to stop falling and start rising. Resistance levels are price points where an asset tends to stop rising and start falling. Identifying these levels helps determine entry and exit points.
3. Analyzing Volume
Volume analysis can confirm the strength of a trend. For instance, increasing volume during an uptrend indicates strong buying pressure, while decreasing volume during an uptrend might signal a potential reversal.
4. Momentum Trading
Momentum traders look for assets showing strong price movement in one direction. They use momentum indicators like RSI and MACD to identify overbought or oversold conditions and make trades accordingly.
5. Reversal Patterns
Reversal patterns indicate a change in the direction of the trend. Common reversal patterns include:
- Head and Shoulders: A bearish reversal pattern with a peak (head) between two smaller peaks (shoulders).
- Double Top and Double Bottom: Patterns indicating potential reversals. A double top is bearish, while a double bottom is bullish.
6. Continuation Patterns
Continuation patterns suggest that the current trend will continue after a brief consolidation. Common continuation patterns include:
- Triangles: Symmetrical, ascending, and descending triangles indicate continuation patterns depending on the breakout direction.
- Flags and Pennants: Short-term consolidation patterns that follow a strong price movement, indicating the continuation of the trend.
Example of Applying Technical Analysis
1. Analyze the Chart
Open a candlestick chart for Bitcoin on a trading platform like TradingView. Set the timeframe to daily to analyze the overall trend.
2. Identify the Trend
Draw trend lines to connect recent highs and lows. Use the 50-day and 200-day EMAs to determine the direction of the trend.
3. Look for Support and Resistance Levels
Identify key support and resistance levels by examining past price action and drawing horizontal lines at significant price points.
4. Use Momentum Indicators
Add RSI and MACD to the chart. Check if the RSI is above 70 (overbought) or below 30 (oversold). Look at the MACD line and the signal line to identify bullish or bearish momentum.
5. Analyze Volume
Add the volume indicator to the chart. Observe if volume increases during price movements, confirming the strength of the trend.
6. Set Up Bollinger Bands
Add Bollinger Bands to the chart to assess volatility and potential price reversals. Look for price touching or crossing the outer bands as a signal.
7. Apply Fibonacci Retracement
Draw Fibonacci retracement levels from the recent low to high (or high to low) to identify potential support and resistance levels during corrections.
Summary
Technical analysis is a powerful tool for crypto traders, providing insights into market trends, potential price movements, and optimal entry and exit points. By using price charts, trend lines, moving averages, volume indicators, momentum indicators, Bollinger Bands, and Fibonacci retracement levels, traders can make informed decisions and improve their chances of success in the volatile cryptocurrency market. However, it’s important to remember that no analysis method is foolproof, and traders should always manage risk and stay informed about market developments.